KnApp - The Knee Visualization App
![]()
Team Knee’d for Speed
Mitchell Crocker
Ezekiel Holmes
Kate Rosenthal
Mario Torres
Sharon Yang
Project Abstract
The Computational Biosciences Lab (CBL) at Boise State University simulates and models knee joint movement and stresses. They are currently producing numeric data sets and results for osteoarthritis patients based on parameters such as loading conditions, anatomy, and movement. These complex, numeric results are understandable for the department generating the data, but it is currently difficult to gather a high-level understanding of this output for clinicians and those unfamiliar with the field.
To help solve this issue, our team has developed an easy-to-use web application with which a user can upload files containing the anatomic data provided by the CBL and see a visual heat map of contact pressure on different parts of the knee as output. Being able to see the Lab’s data in this way will hopefully make it more easily understandable and usable for clinicians.
Project Description
What We Built
The web application we’ve built performs three key functions:
- File Uploading: Users can upload geometry and results data files in .inp and .csv format, respectively. The data in the geometry file determines the shape of the image produced by the app and the results file determines the pressure values and colors assigned to each individual element in the image.
- Data Parsing: The site parses geometry and results files and handles the data in a way that the site can use to create an image. Geometry files are parsed into a 2D array of individual node numbers with x, y, and z values and a 2D array of element numbers with each node number corresponsing to nodes in that element. Results files are parsed into a 2D array of elements with the change in pressure on each individual element over a period of time. The point in time where the highest pressure occurs is also stored, along with the highest and lowest pressures at that time.
- Image Generating: The site uses the parsed data to generate an accurate image of pressures on the knee at the point in time that the highest pressure is occuring by drawing it on an HTML canvas element. The map draws each element based on the x,y coordinates of each of its nodes and then applies the proper colors from the heat map key to each element based on its pressure at this point in time from the result file data. Colors are assigned based on a linear scale calculated from the highest pressure to the lowest pressure to allow for each image to have its own unique and accurate color mapping.
The application was built entirely using basic HTML, CSS, and JavaScript code and does not rely on any outside frameworks, libraries, or databases.
Note: Due to the importance of parsing data for this application to run, file format is extremely important.
All Geometry files must be in .inp format, meaning they have distinctly labled ‘node’ and ‘element’ sections, and, if they are cartilage files, ‘side’ node sections as well, followed by the data itself immediately on the next line. For the node data, each line will represent a unique node. Each line must contain only the node number and its x, y, and z values all seperated by commas. For element data, each line will represent a unique element and each line must contain only the element number and the node numbers of all nodes belonging to that element, again, all seperated by commas.
For the Results files, each line of the .csv file will represent a unique element and the pressure exerted on it over a given time period. The first item on each line will be the element’s number followed by the comma seperated pressure values. Each column of the file after the first will represent a single point in time.
How It Works
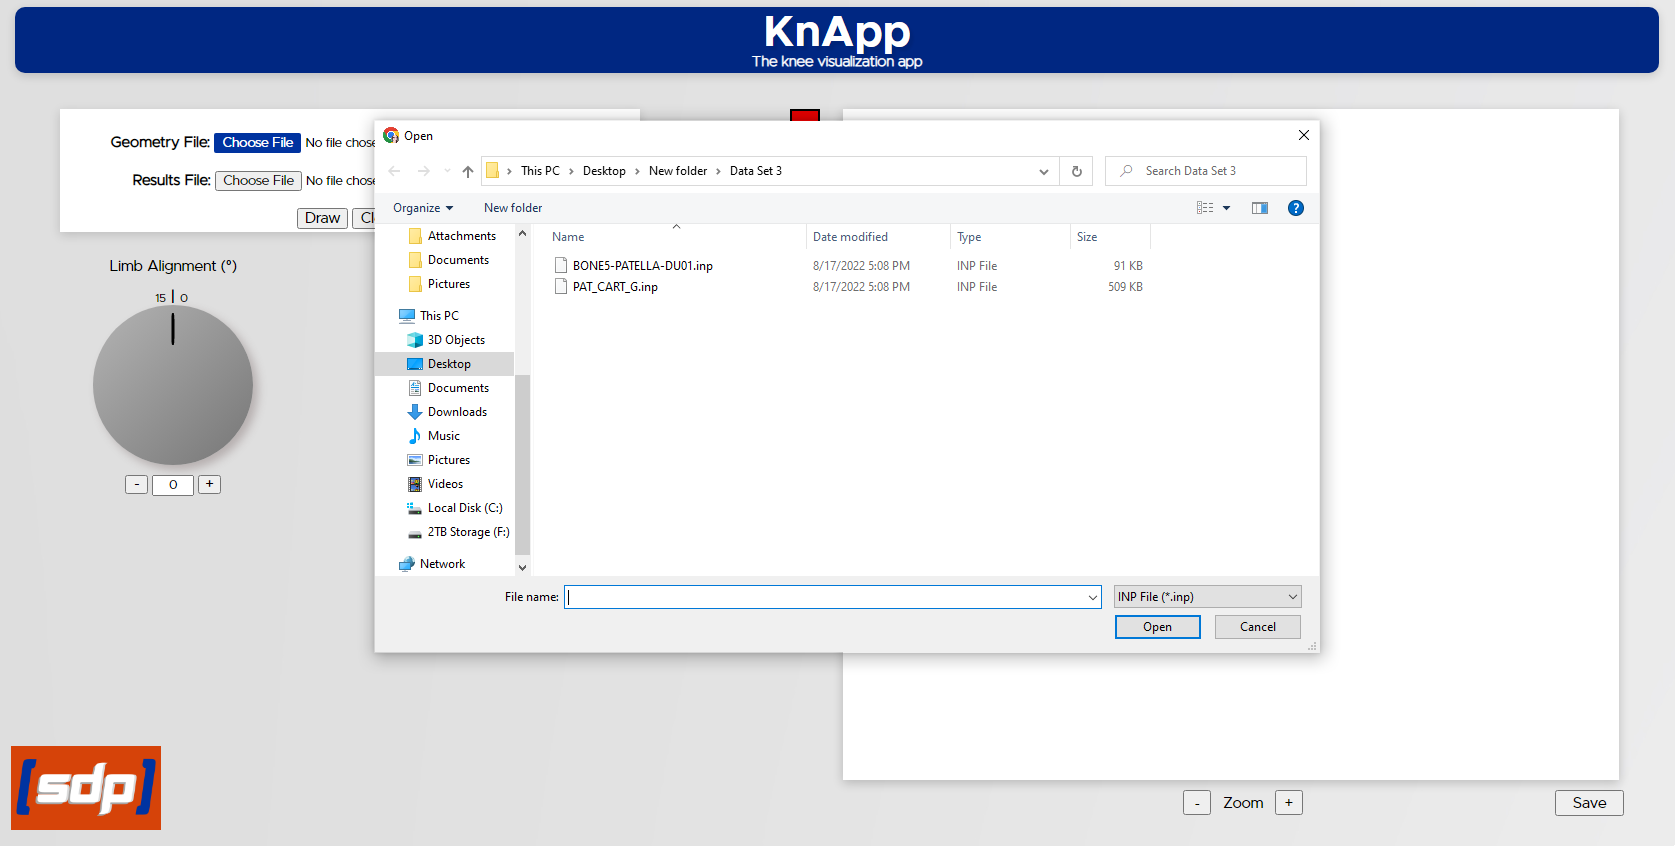
To use this web application, a user must first click on the “Choose File” button in the upper left of the web page following the “Geometry File” label and select a Geometry data file from their local drive. Files must be in .inp format and the file name must include the tissue type it will produce- ‘bone’ for bone files and ‘cart’ for cartilage files.
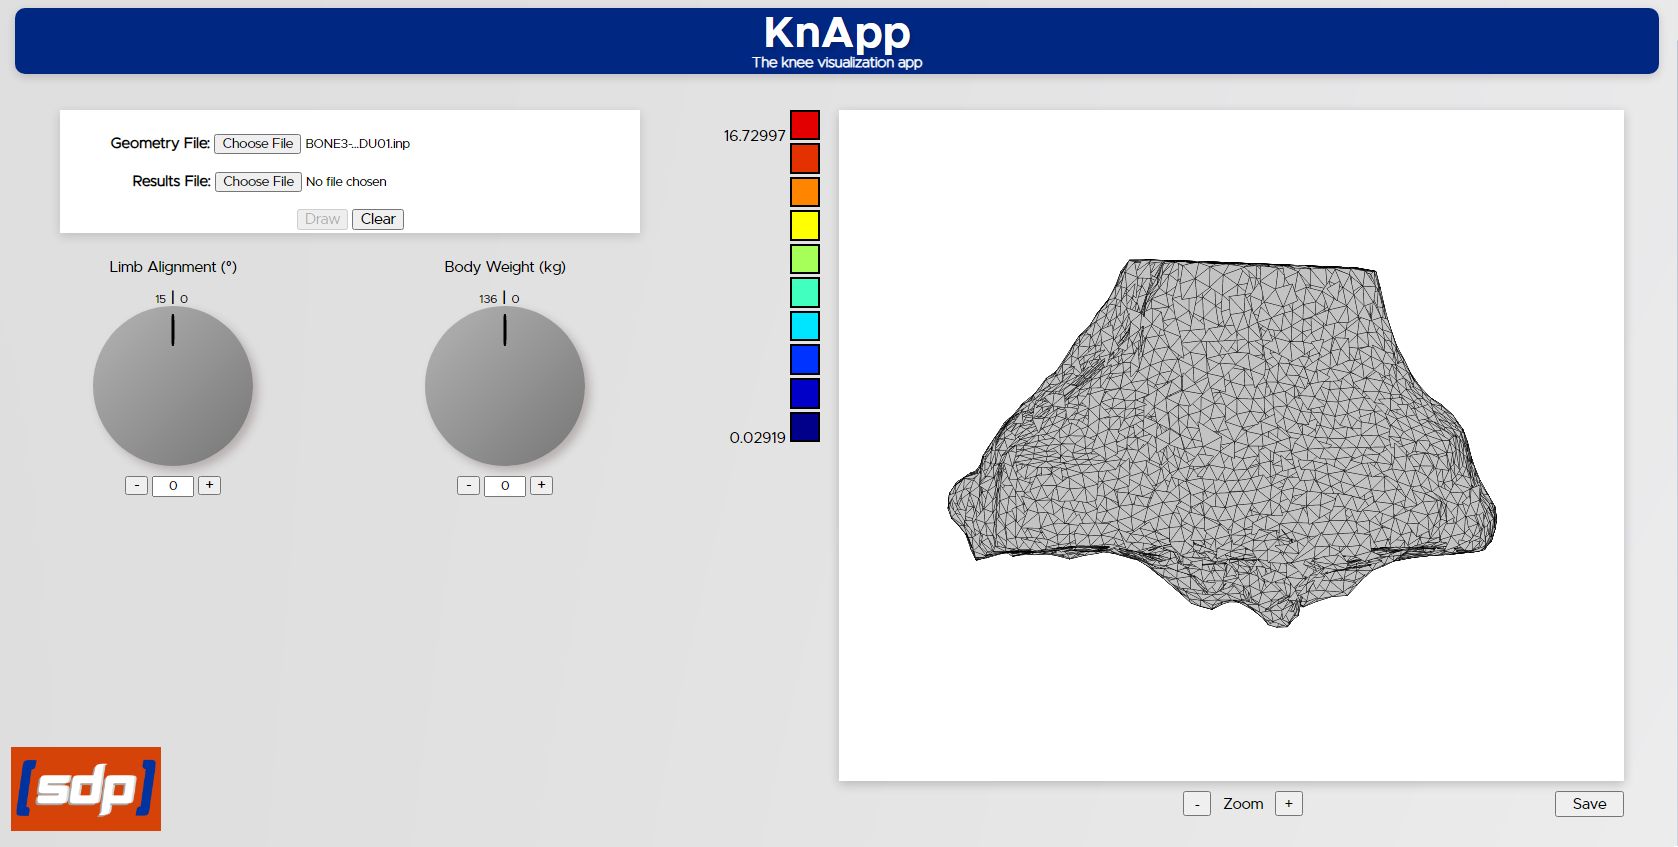
If the file is a bone file, the user can draw it accurately without a corresponding result file, as the app is only designed to generate pressure maps for cartilage. Bones are drawn entirely in grey, such as the tibia geometry below.
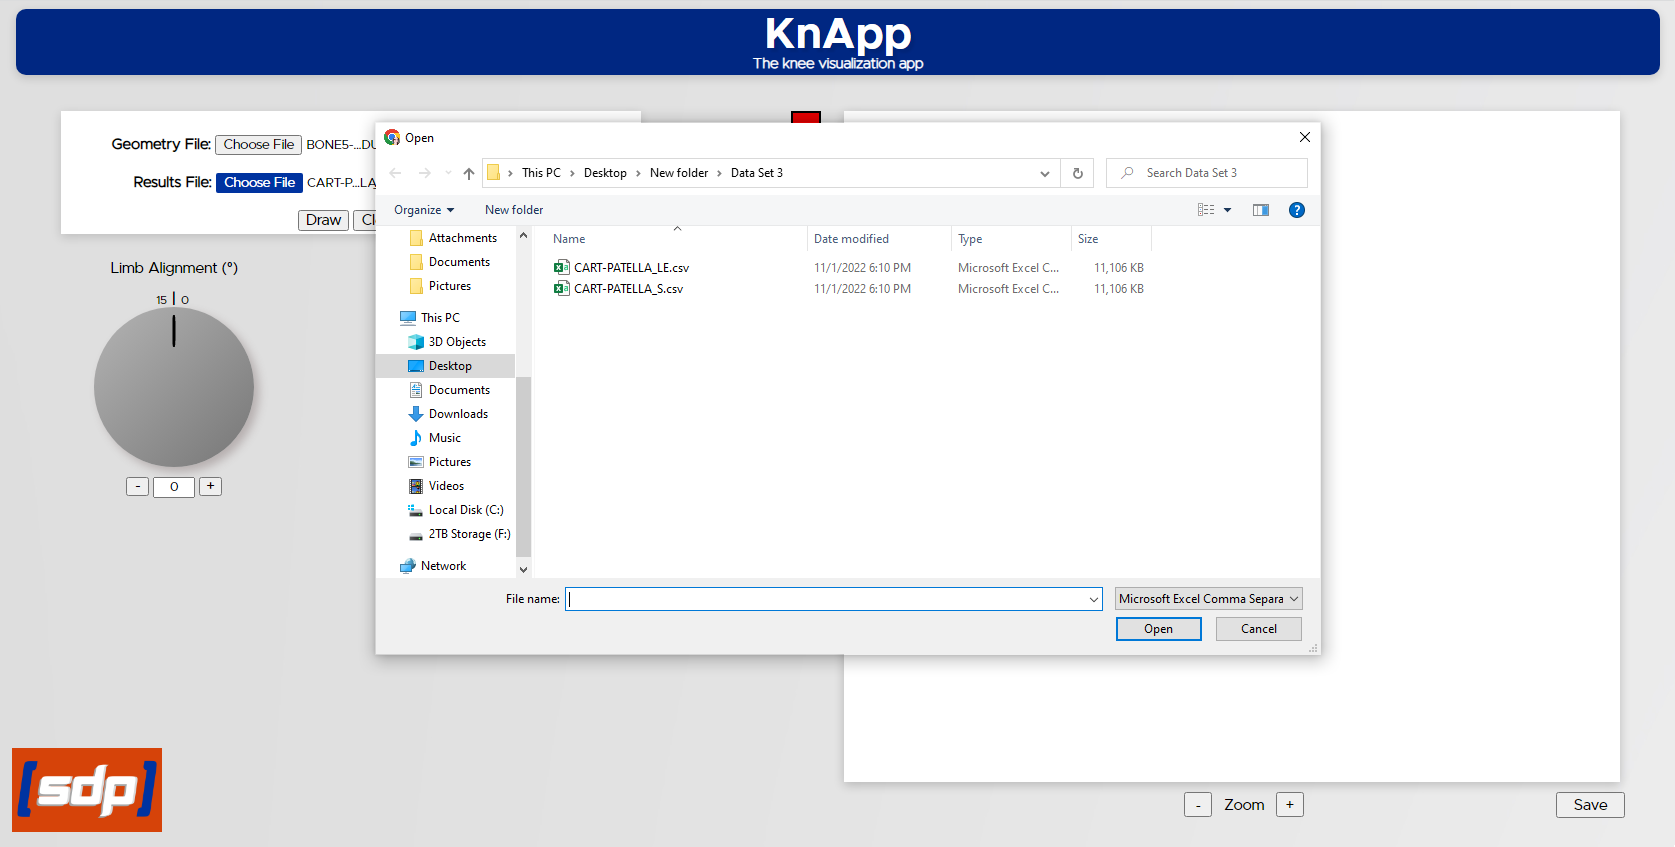
If they are working with a cartilage file, users must then click on the “Choose File” button following the “Results File” label and select a Results data file from their local drive. Results files must be in .csv format and the file name must include the pressure type it will display- ‘_S’ for stress files and ‘_LE’ for strain files. If they do not select a results file, the cartilage will be drawn in one single color rather than with a heat map applied.
Once their file(s) are chosen, the user must click on the “Draw” button to generate their image. The image will appear in the canvas element on the right side of the web page.
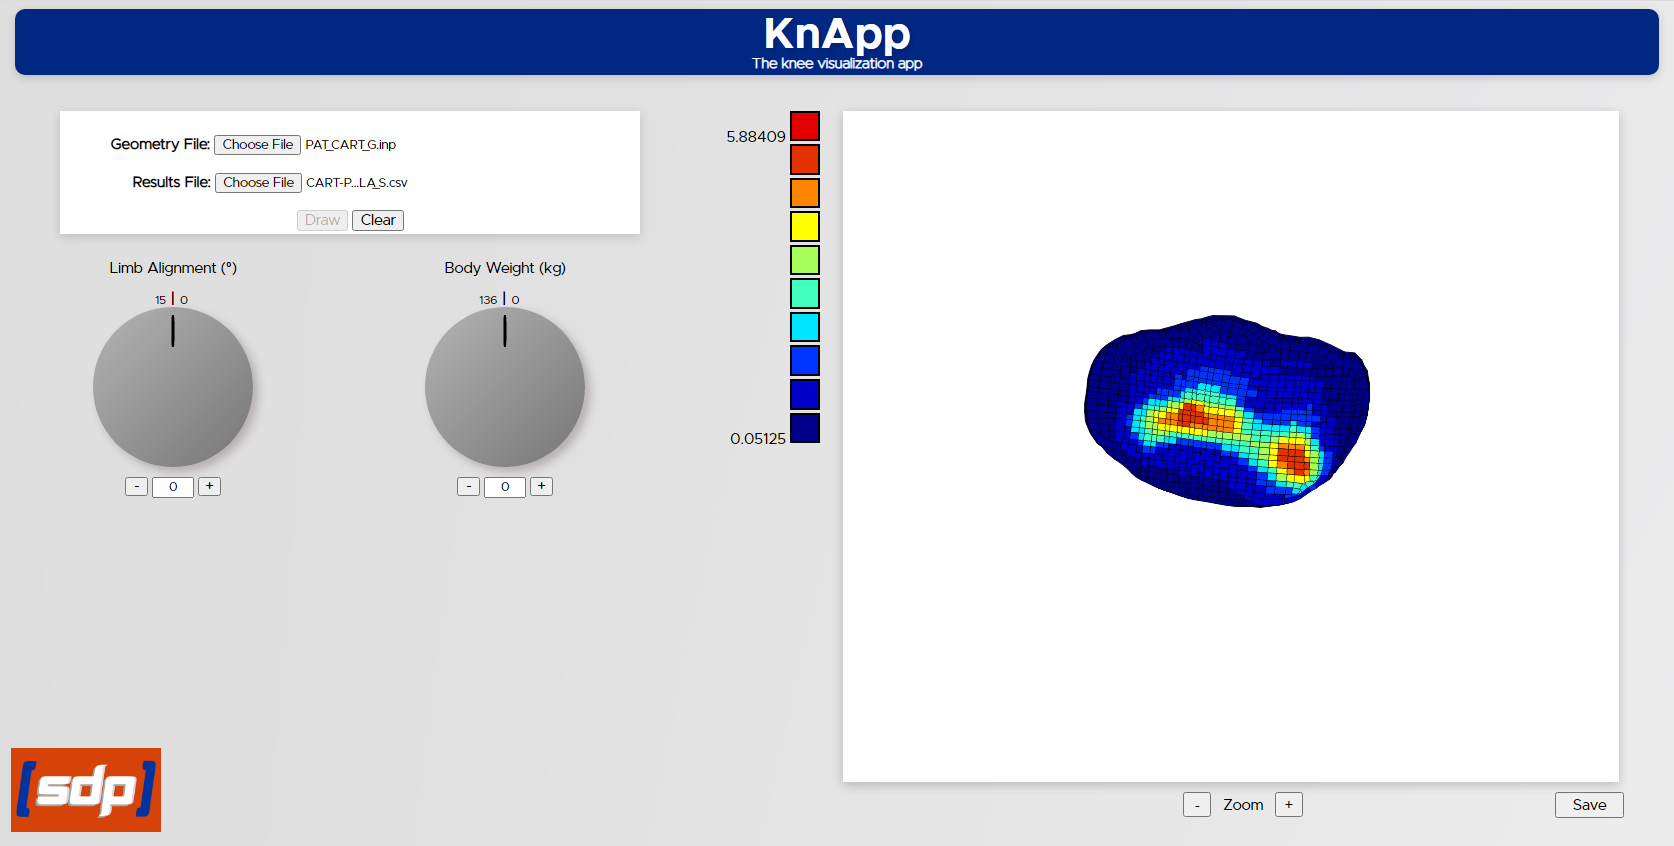
The following image shows the map of a stress results file on a patella cartilage geometry file:
This image shows the map of a strain results file on the same patella cartilage geometry file as above:

This image shows the map of a stress results file on a femur cartilage geometry file:
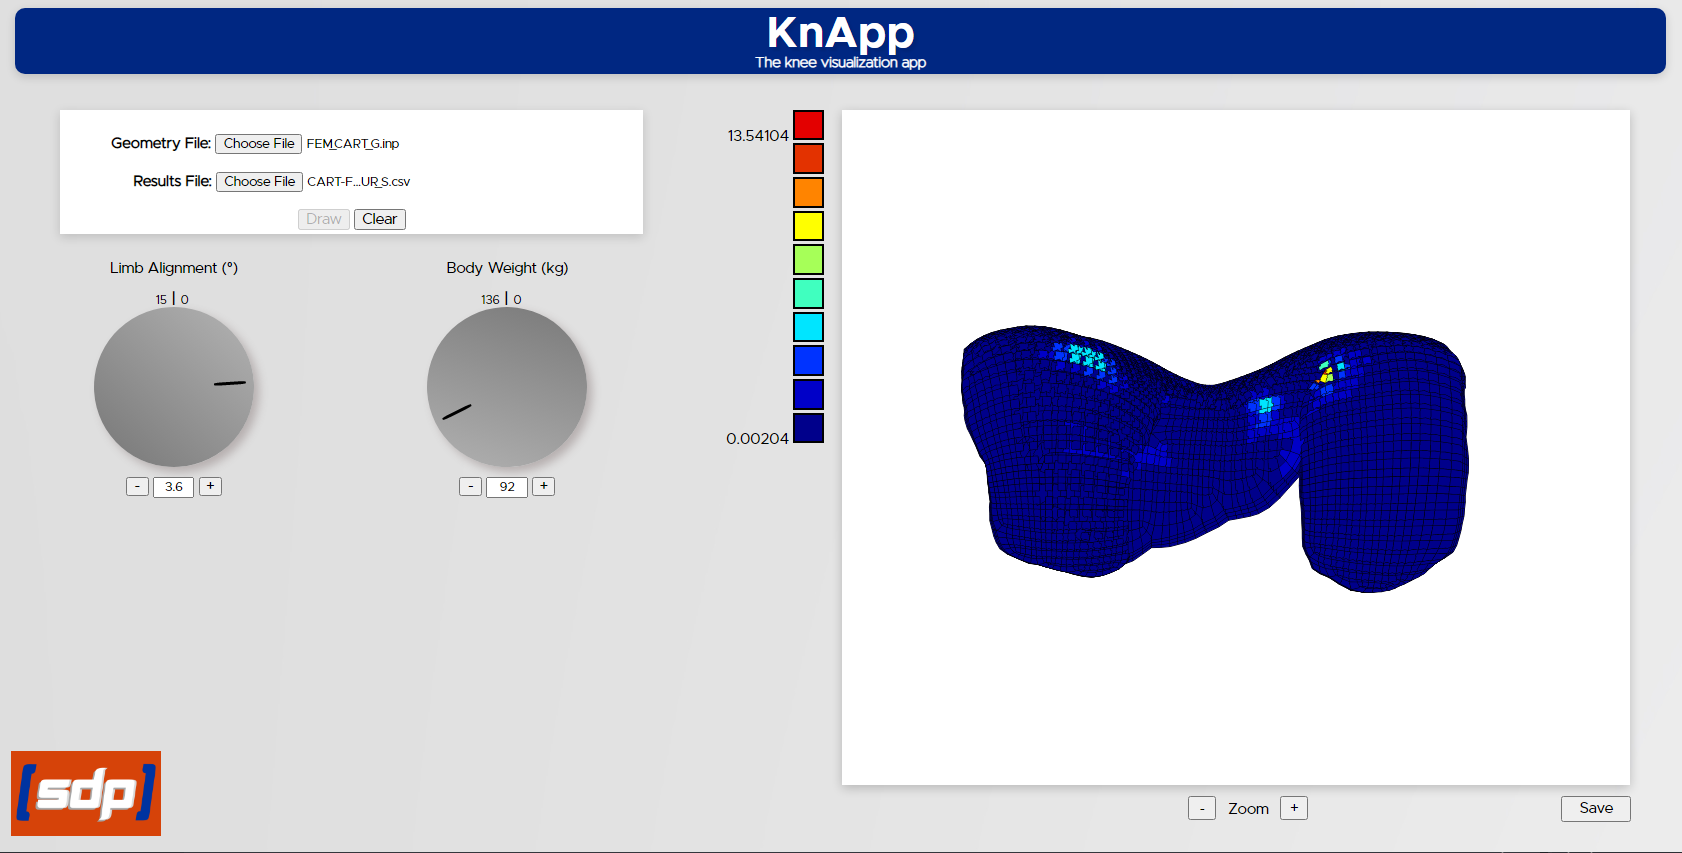 Note: when drawing femur cartilage in particular, the app can run very slowly due to the sheer size and number
of unique nodes and elements
Note: when drawing femur cartilage in particular, the app can run very slowly due to the sheer size and number
of unique nodes and elements
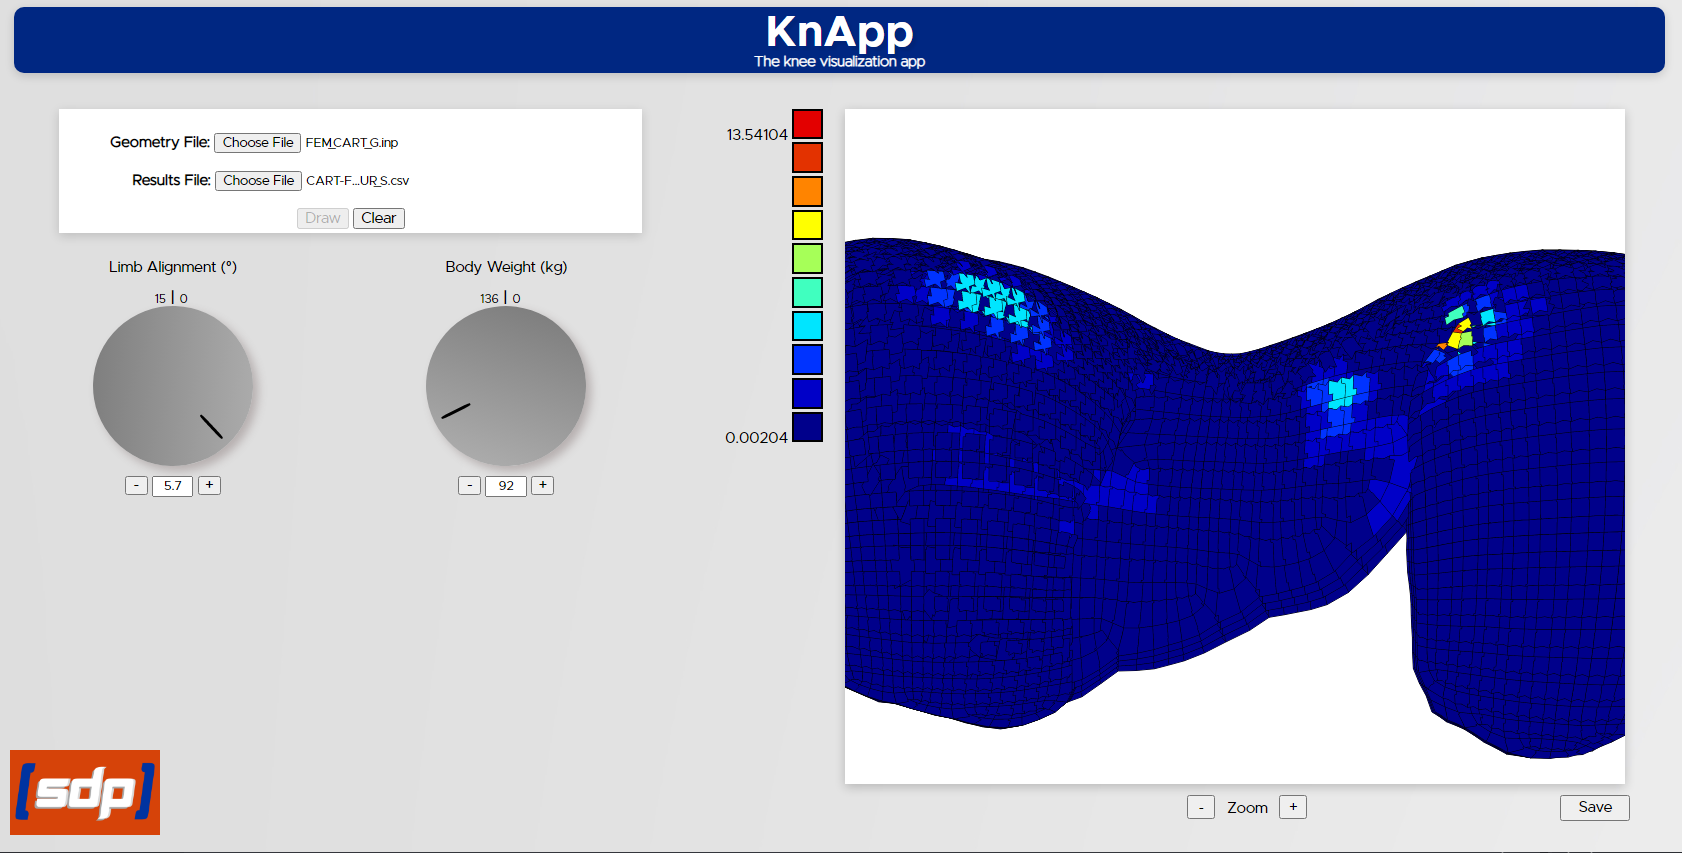
Users can then Zoom in or out on the image they have created and are also able to save a .png file of
the image using the buttons located below the canvas.
To draw another image, users can click on the ‘Clear’ button located next to the ‘Draw’ button to reset the page completely, or they can simply choose a new geometry or results file from either or both of the file selection buttons and click ‘Draw’ again.
Currently, the parameter dials on the left side of the page do not affect the generated heat map. They can be turned by clicking and dragging to rotate them, by clicking or holding the ‘+’ and ‘-‘ buttons below them, or by manually entering a value in their indicated range in the number input area below them. Future work on the project could allow these values to update the heat map in real time for the user to show them how changes to these parameters could change where or how much pressure is being applied to different parts of the knee.
Visit the App
Note: for the app to work properly, you must have a set of properly formatted files from the CBL